
Monthly index
The exit-friction index
A price is what the last trade happened at. It is not what you would receive. Once a month we take every token we can measure and record the gap between the two.
October 2026 · provisional
- Median loss
- 28.72% on a $100,000 sell
- Middle half
- 9.49–77.64% from the 25th to the 75th percentile
- Lost more than half
- 38.4% of tokens measured
- Lost under 1%
- 4% of tokens measured
October 2026 · provisional, month still open
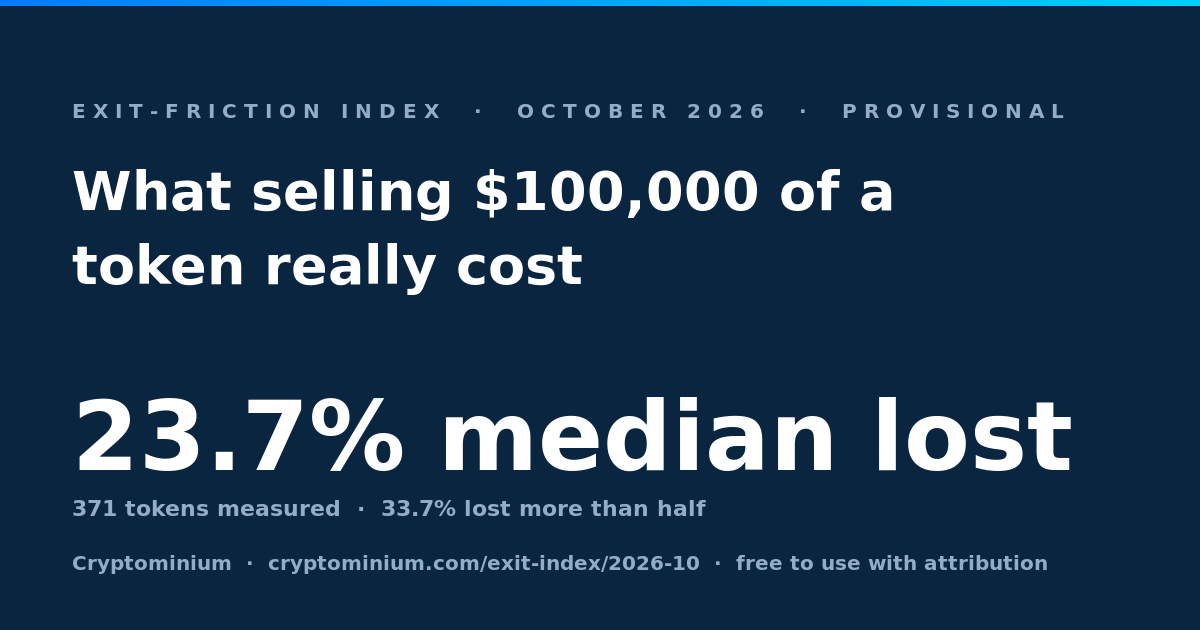
Of the 422 tokens with a live on-chain market on Base, Ethereum or BNB Chain, the median lost 28.7% selling $100,000. 38.4% lost more than half.
Cite this Cryptominium, "Exit-friction index, 2026-10 (provisional)", measured 2026-10-25. https://cryptominium.com/exit-index/2026-10
We track 1,253 assets. 823 have a contract on a covered chain, and 608 of those returned no on-chain price when we asked — an asset whose real market is a centralised exchange, or a receipt token never meant to trade, is invisible to this measurement rather than illiquid. The index is only ever a statement about the 422 we can see.
Worst measured this month: BASEDHYPE at 99.98%. Every token is priced at the same $100,000 so the months stay comparable — see the method.
The series
This is the part that cannot be bought. A single month is a snapshot; the direction of travel over a year is a measurement nobody can reconstruct after the fact.
| Month | Tokens | Median | Middle half | Over half lost |
|---|---|---|---|---|
| October 2026 (open) | 422 | 28.72% | 9.49–77.64% | 38.4% |
| September 2026 | 86 | 14.53% | 3.72–54.61% | 25.6% |
| August 2026 | 78 | 14.99% | 3.23–47.82% | 24.4% |
Citing this
Quote it freely, with a link. The figure moves each month and the wording of the universe is part of the figure — “of the tokens with a live on-chain market” is not decoration, it is what the number counted.
Suggested citation: Cryptominium Exit-Friction Index, October 2026. https://cryptominium.com/exit-index
See every measurement behind it Download the series (CSV) → · The full dataset, with every token (CC BY 4.0) · Download the chart (PNG, free with attribution) · JSON How it is measured →
The exit-friction index
Once a month we publish what a $100,000 exit really costs across every token we can measure. Leave an address and this month’s figure arrives straight away, and we will write again when the next index publishes. Nothing else, and never to anyone else.
The index measures on-chain routing on the chains named above. It is market information, not financial advice, and it is not a statement about any token’s value.