
Measurement report · November 2026 · provisional, month still open
November 2026: what it cost to sell $100,000
Of the 444 tokens with a live on-chain market on Base, Ethereum or BNB Chain, the median lost 34.5% selling $100,000. 41.4% lost more than half.
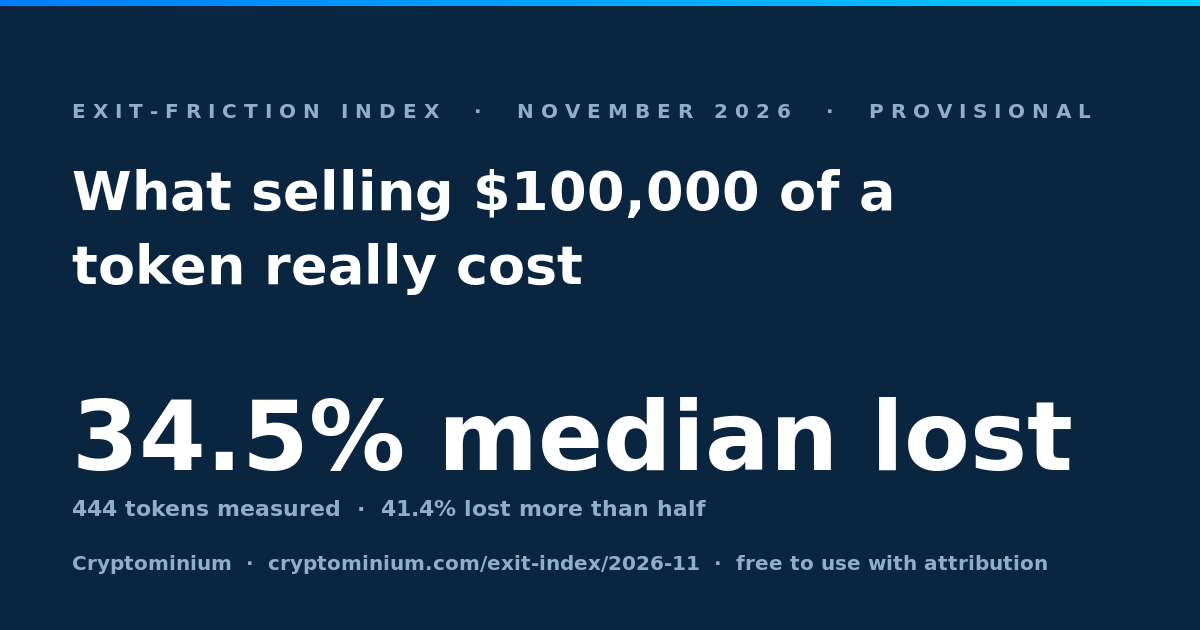
Free to use with attribution. Every token named below links to its own measurements.
Provisional · month still open
- Median loss
- 34.51% on a $100,000 sale
- Middle half
- 11.64%–78.77% the middle 50% of tokens
- Lost more than half
- 41.4% of 444 tokens measured
- Lost under 1%
- 3.4% of 444 tokens measured
Cite thisCryptominium, "Exit-friction index, 2026-11 (provisional)", measured 2026-11-14. https://cryptominium.com/exit-index/2026-11
What this covers. We track 1,346 assets. 886 have a contract on a covered chain, and 663 of those returned no on-chain price when we asked — an asset whose real market is a centralised exchange, or a receipt token never meant to trade, is invisible to this measurement rather than illiquid. The index is only ever a statement about the 444 we can see.
01 What moved
The index rose. The tokens got worse.
A caveat on our own headline, published because somebody checking it against the CSV would find it in an afternoon.
The headline went from 28.54% in October 2026 to 34.51% this month, a move of +5.97 points. That is not the same statement as “selling got harder”, and the difference matters more than the figure.
- 64 easier to sell
- 101 within half a point
- 216 harder to sell
381 tokens were measured in both months. Across those, the median change was +0.82 points: 64 improved, 216 deteriorated, and 101 stayed within half a point. The two agree this month, which is the ordinary case and worth stating anyway: when they disagree it is the composition of the sample, not the market, and that is the failure mode of every index built on a universe that is still growing.
02 Across chains
The same ticker is not the same market
100 tickers were measured on more than one chain this month.
They are not one asset with one exit cost; they are separate pools with separate depth, and the gap between them is routinely larger than the whole spread of the index.
The practical reading: the figure you have seen quoted for a token is a figure about a market in it. If you hold the bridged version, the number that applies to you is the one for the chain your balance is actually on.
03 Depth
A deep pool is not a sellable one
Pool size is the figure that is cheap to get. This is the one that was measured.
Liquidity is the figure most sites publish instead of measuring an exit, because it can be read off a contract. These tokens each carry a pool of over a million dollars and still lost a fifth or more of a $100,000 sale:
ELEPHANT on BNB Chain
- In the pool
- $18,932,975
- Median loss
- 93.83%
KNC on Ethereum
- In the pool
- $1,981,046
- Median loss
- 41.12%
O on BNB Chain
- In the pool
- $1,129,603
- Median loss
- 32.37%
Depth is not the only thing that decides an exit. Where the depth sits in the curve, how concentrated it is in one venue, and what the router can actually reach all matter, and none of them are visible in a total. That gap is the whole reason this series exists.
04 The spread
There is no typical token
Two ends and not much of a middle, so the median says less than a median usually does.
5.6% of measured tokens lost under 2%, and 41.4% lost more than 50%. The distribution has two ends and not much of a middle, which means the median is a weaker summary of it than a median usually is: there is no typical token here, there are deep markets and there are thin ones.
05 Coverage
What we could not see
Invisible to this method is not the same as illiquid.
We track 1,346 assets. 886 have a contract on a chain we cover, and 444 of those returned a price we could route against. The rest are not illiquid — they are invisible to this method. An asset whose real market is a centralised exchange, and a receipt token that was never meant to trade, land in the same bucket.
That is why the headline says “of the tokens with a live on-chain market” and never “of the top 500”. The second sentence is unsayable from this data, it is the sentence this index was originally going to use, and finding out why it was wrong is the reason the denominators are printed on every month.
06 Use it
Check it, then cite it
Every figure above comes from one table.
The series is downloadable, every token named links to its own measurement history, and the method is written down. If a number here is wrong we would rather hear it from you than not know.
The series as CSV
Every month, with its counts and its percentiles.
The chart as PNG
This month as one image. Free to use with attribution.
The index and every month
The figure, its scope and the full series.
Every measurement behind it
Each token’s own readings, day by day.
How it is measured
The method, written down, so the figures can be reproduced.
The series as JSON
The same figures, for a program to read.
This report measures on-chain routing on the chains named above, at one fixed sell size. It is market information, not financial advice, and it is not a statement about any token’s value or its future.